2 Introduction
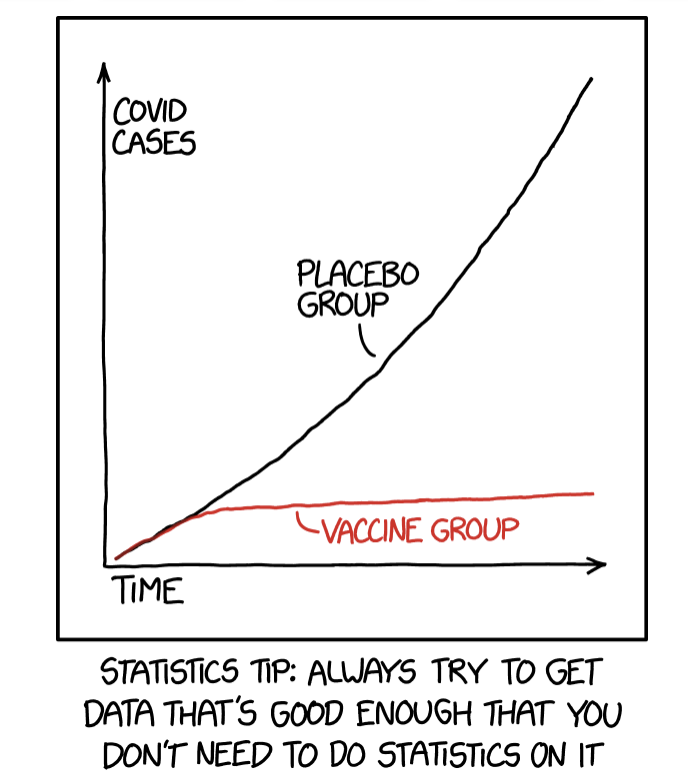
Figure 1.1: We reject the null hypothesis based on the ‘hot damn, check out this chart’ test. https://xkcd.com/2400/
2.1 Course Goals
Our goals in this course are:
- to better evaluate quantitative information with regards to clinical and biological data. We’ll be sure to keep in mind:
- Careful presentation of data
- Consideration of variability
- Meaningful comparisons
- Careful presentation of data
- to be able to critically evaluate the medical literature with respect to design, analysis, and interpretation of results.
- to understand the role of inherent variability and keep it in perspective when inferring results to a population.
- to critically evaluate medical results given in the mainstream media.
- to read published studies with skepticism. Some people (in all fields!) wrongly believe that all studies published in a peer review publication must be 100% accurate and/or well designed studies. In this course, you will learn the tools to recognize, interpret, and critique statistical results in medical literature.
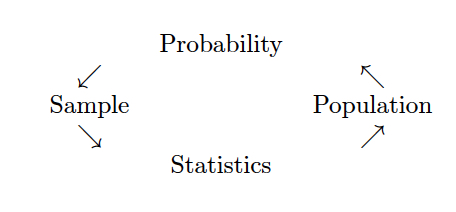
Figure 1.2: Probability vs. Statistics
2.2 Using R
Much work will be done in R using RStudio as a front end. You will need to either download R and RStudio (both are free) onto your own computer or use them on Pomona’s server.
You may use R on the Pomona server: https://rstudio.pomona.edu/ (All Pomona students will be able to log in immediately. Non-Pomona students need to go to ITS at Pomona to get Pomona login information.)
If you want to use R on your own machine, you may. Please make sure all components are updated: R is freely available at http://www.r-project.org/ and is already installed on college computers. Additionally, installing R Studio is required http://rstudio.org/.
http://swirlstats.com/ is a great way to walk through learning the basics of R.
All computing assignments should be turned in using R Markdown compiled to pdf.
, by Ismay and Kim](figs/RRstudio.jpg)
Figure 2.1: Taken from Modern Drive: An introduction to statistical and data sciences via R, by Ismay and Kim
, PhD student at Newcastle University](figs/cookingRstudio.jpg)
Figure 2.2: Jessica Ward, PhD student at Newcastle University
Experimental Design
In this class we’ll talk about techniques used to analyze data from medical studies. Along with the computational methods, however, we’ll continue to think about issues of experimental design and interpretation.
Descriptive statistics describe the sample at hand with no intent on making generalizations.
Inferential statistics use a sample to make claims about a population
Simple Random Sample is an unbiased sample. Sample is selected in such a way that every possible sample of size \(n\) is equally likely.
Blind / double blind when the patient and/or doctor do not know which patient is receiving which treatment.
Placebo mock treatment
Sample size reduces variability (large samples make small effects easier to discern)
Experiment vs. Observational Study whether the treatment was assigned by the researchers; randomized experiments make concluding causation possible
Funding of study goals, bias